Handbrake - round four
The stats say the Port loss was ok, the stats are annoying.

Firstly, the response to my first post was both unexpected and appreciated, my thanks especially to anyone who passed the link on to someone else. It’s great to be writing about footy again, and fun to be coming at it from a different angle.
Which brings me to something I want to say about footy media in general, because I’ve had a few messages this week from people who feel let down by what we are being served up on on TV and online.
Rather than say everything sucks, I’ll give a shoutout to some of the areas that I find interesting. David King and Leigh Montagna are across broadcasts and TV programs lifting the lid on what the numbers are saying, the ESPN Footy Podcast is built around Champion Data and is a great listen and the Fox Footy Podcast has been talking for years about looking just beyond the win-loss ratio, Max Laughton in particular.
I wish there was more, but I suspect broadcasters aren’t deliberately ignoring stats but instead serving the audience they have. I’d love for there to be about one fiftieth the amount of free agency and trade chat, but you also better believe I’m hoovering up the first article or segment that hints Richmond are in the Butters conversation.
Then there’s the Richmond angle. Even for a Big Club™ we aren’t that interesting right now. It’s entirely reasonable that outlets don’t spend much time on Richmond’s gameplan and style because, quite frankly, it sucks. We’ve won seven games in two and a bit years and other than as a study in list rebuilding, our games are ignorable and increasingly off-Broadway. Nobody is going to spend ten minutes on whether our D50-to-F50 percentage is improving, that’s for weirdos like me to worry about.
Rebuilds are, above everything else, quite boring until all of a sudden when you realise you’re built. From what we’ve seen so far this year, we are quite a way off that.
A reminder that all the data sitting behind this is available here and updated weekly, and all of it comes directly from the fantastic Wheelo.
Port Adelaide loss
We used to have forwards who could kick six goals on their own but for the last two rounds, that’s what the entire team has kicked.
This is the point where people who watch games rather than what happens on the stat sheet go around the bend, but while the eye test said horrific - the stats said it wasn’t that bad. On xScore Richmond generated almost identical expected scoring to Port, while over on the actual scoreboard we lost by seven goals and were only really in the game for a burst in the second quarter.
The possession chains were working, we were moving the ball from defensive 50 to forward 50 above the league average and better than Port Adelaide managed. We also only kicked six goals over four quarters of football in what looked close to perfect conditions (admittedly from the comfort of my couch).
That’s where the xScore conversation gets both interesting and maddening at the same time. I’ve always had a problem with expected score being talked up in a loss, not because the math is wrong but because teams defend the actual scoreboard, not the expected one. Would Port Adelaide have let Richmond run up so many missed set shots if it were two goals the difference rather than five?
Richmond’s process against Port was better than the scoreboard suggests, the scoreboard itself suggested they lost by seven goals. Whether you think this is all part of the plan or are part of the (increasing?) what on earth are we doing crowd, there was something there for you.
Deep dive: D50 to F50 transition
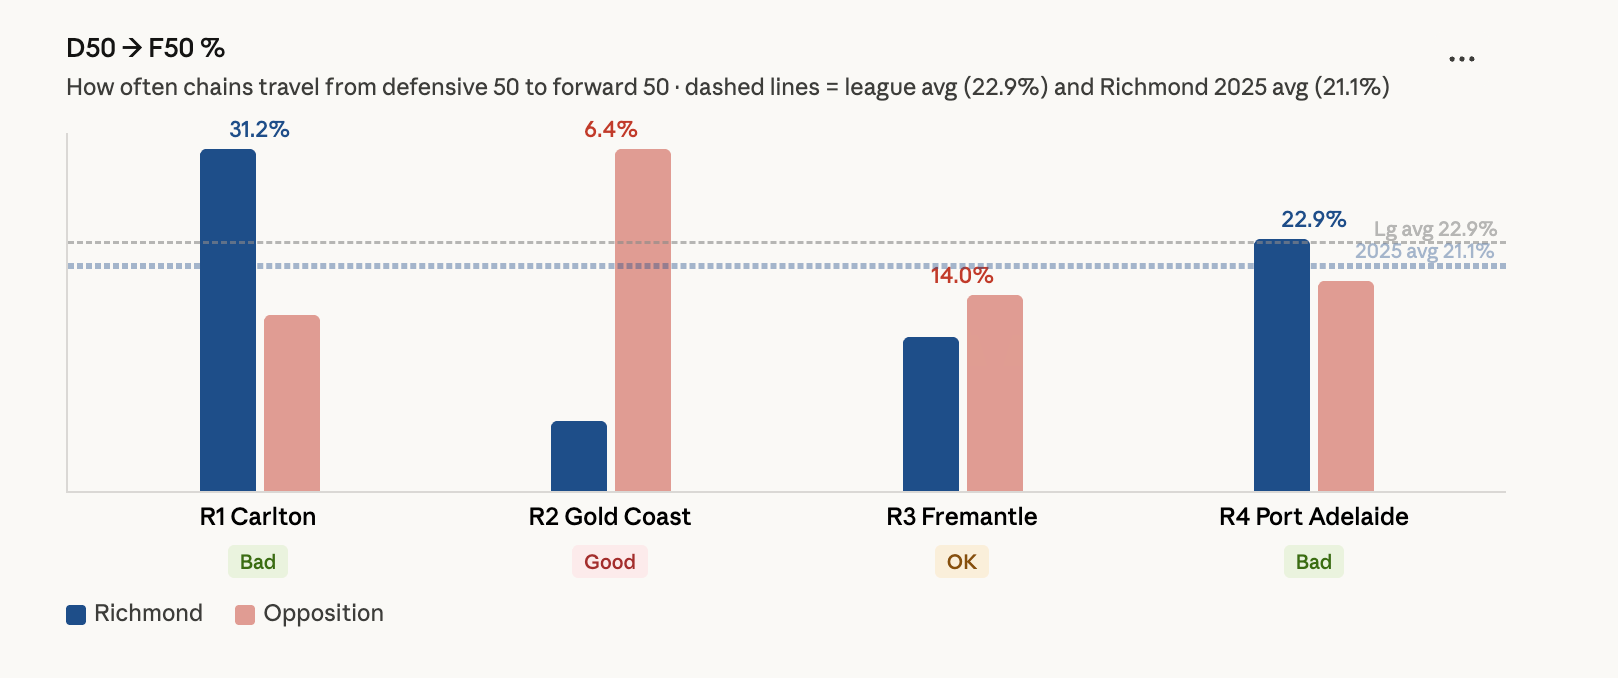
For some reason I’m obsessed with this stat. D50-to-F50 percentage measures how often ball movement travels from defensive 50 all the way to forward 50. It’s the most direct measure of whether the handbrake is off or on.
Moving the ball slowly doesn’t mean you can’t transition, but it makes it harder - especially when your key forwards all still have pimples.
Four games in, the tier split is real. Against Carlton we registered 31.2% and Port Adelaide 22.9%, both above league average this season and above our 2025 season average. When they’re playing a side similarly splashing around in the shallow end of the pool, the ball is moving even if it doesn’t always look like it.
Against Gold Coast it was 6.4% and Fremantle 14% Both below average, and the Gold Coast number would have been the second worst in Richmond’s entire 2025 season.
The opposition numbers add their own uncomfortable context. When our transition collapses, the opposition is doing the opposite. Gold Coast were getting the ball forward at 34.6% in round two, and Fremantle hit 65 inside 50s in round three.
The chains are breaking down not because Richmond stops trying to move it forward, but because better defensive pressure cuts them off before they get there. Remember in peak Dimma Richmond when we’d set up a defensive grid and squeeze teams? It was sure a lot more fun being on the good side of it.
What’s interesting is that 2025 didn’t show this pattern, the transition numbers were flat across all opponent tiers. Richmond played essentially the same game against everyone. The tier split emerging in 2026 after just four games is actually the shape the handbrake theory predicts, whether it holds as the season goes who could tell, but the early signal is more encouraging than it might seem while watching the actual football.
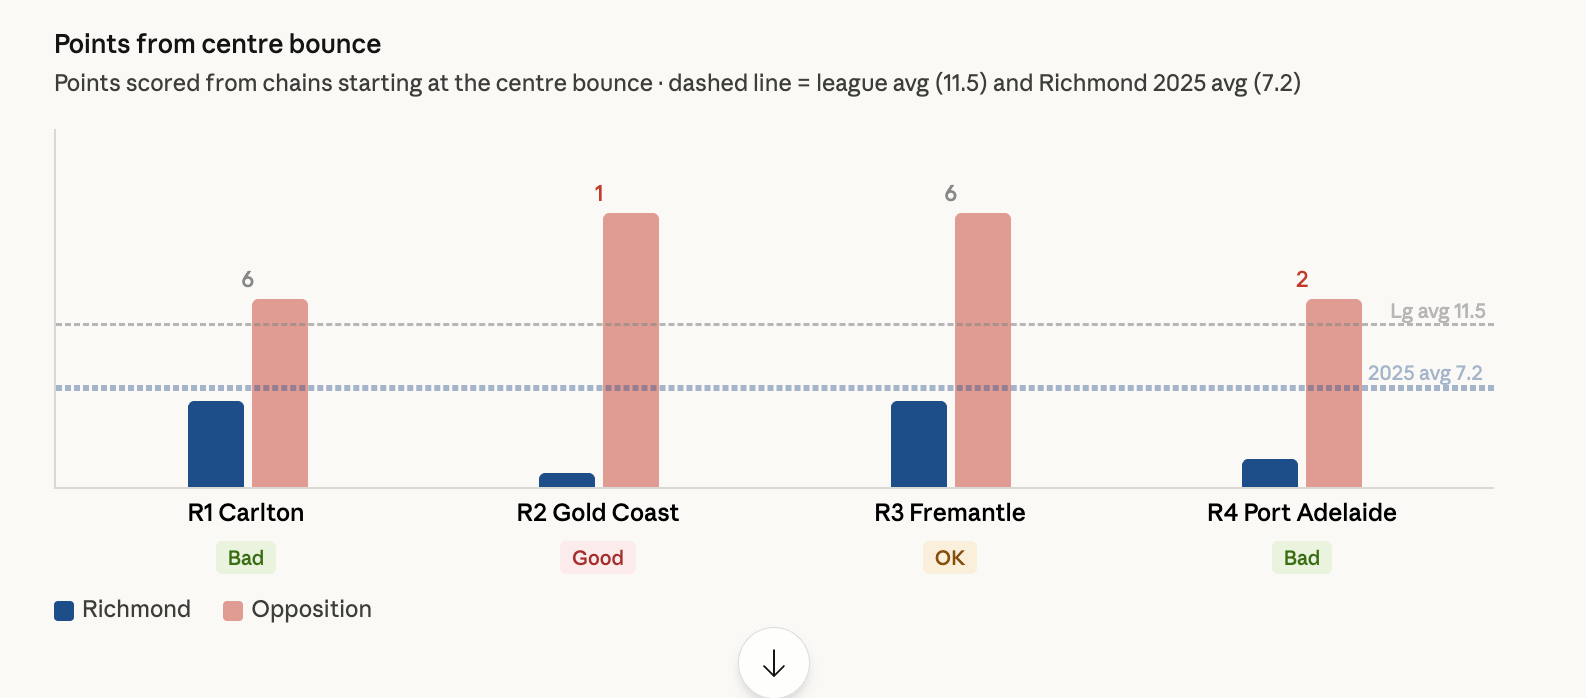
Deep dive: points from centre bounce
David King had Richmond’s centre bounce problem pinned before the data was flowing. A couple of weeks ago he coined it the “gumboot brigade”, the kind of crack you feel obliged to defend as a fan but is a fair assessment of the midfield mix.
Not silky, not dynamic, not moving quickly and not producing the service that turns a centre clearance into a scoring chain. We look like we’re playing in long stops while everyone else is in moulded boots.
What we’re talking about here is teams scoring directly from the centre bounce. We’ve scored 6 points, 1 point, 6 points and 2 points through the first four rounds, for a season average of under 4 points per game. The league is averaging 11.4. Last year we averaged 7.22, which sucked then, and somehow we’ve gotten worse.
That 2025 to 2026 context matters. The removal of the centre bounce rewards timing and positioning over the pure tap ruck, and has shifted the centre clearance dynamic considerably. Everyone else is zigging and we are zagging.
Our mids seem to get the ball while standing still, the best midfielders are hitting it at pace. And for me, this is the most interesting selection question to play out. My from-the-cheap-seats take is that Prestia and Hopper can’t play in the same midfield, things might slow down when we hit winter but my hunch is they’re going to need to pick one of them only before long. Which would be the first big selection call of the Yze era, so I wonder how long they’ll put it off and hope it fixes itself.
Contrasting with Gold Coast and our old gaffer is even more uncomfortable. The Suns are averaging 19.7 points from centre bounce across their first three games, nearly five times Richmond’s output. In round two specifically: Gold Coast 19, Richmond 1. We aren’t good enough to be giving teams a three-goal start from one stat.
Shallow dive: what the attacking leaderboard is telling us
Four games in and there are a few things worth pulling out of the player-level data.
Sam Lalor leads the xScore differential at +6.8, meaning he’s converting above expectation from the shots he’s taking. For a player who is still finding his forward role, that’s an encouraging sign - he’s getting reasonable shots and hitting them.
Given how everyone else is kicking, I propose we all jump the fence and run on the ground if Lalor or anyone else goes +30 across the season.
The most active scoreboard pepperer is Steely Green, with 12 shots, but -11.0 against xScore. He’s taking shots from mostly good positions and missing them. If he closes that gap and nabs one that he would usually miss, then we’re talking about a really good season unfolding - the margins are fine.
I’ve added an extra stat in there: ThreatRating per game, my first response to reader feedback. This measures whether each player’s kicks are generating more or less scoring threat than the situation warranted, positive means their kicks are going to dangerous places and negative means they’re taking the safer option. If I’m being completely honest I’m not entirely sure what this means, but I’ll get my head around it in the near future and if I can’t, I’ll probably never bring it up again.
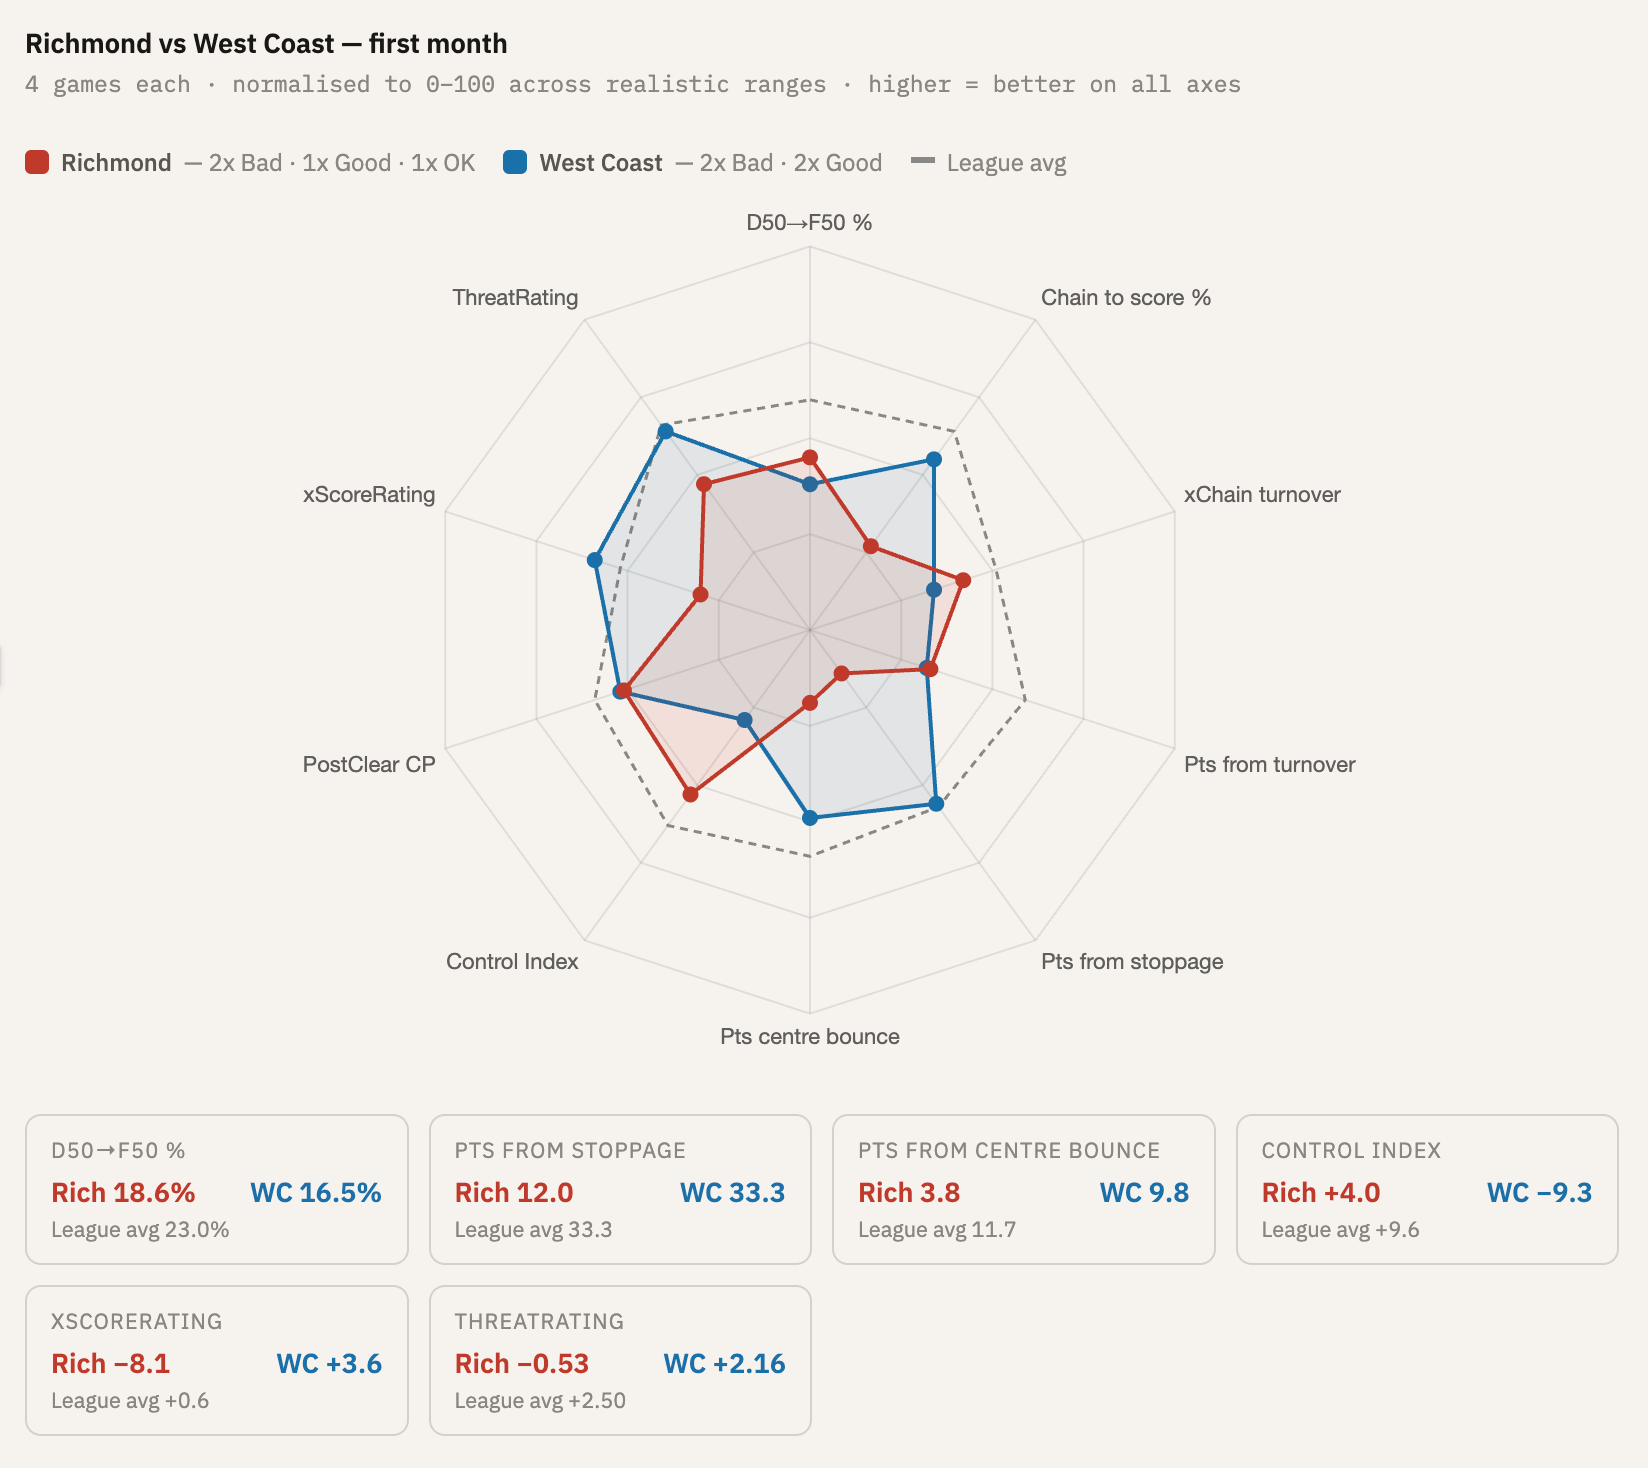
More to come: West Coast comparison
I’ve also set up a table tracking our game style against West Coast which is serving up some really interesting points of comparison that I’ll unpack in the next couple of weeks and track over the season.
You can see the summary data below, and dig deeper with a more interactive version over on the dashboard.
If you liked this and think someone else might be interested, please share the link and click subscribe below so you get an email whenever I write next. I’ll do my best to get something up weekly, but if life gets in the way — I’ll always update the dashboard reasonably promptly after Wheelo releases the data.
Last week I missed a shout out for two people covering footy that I have to rectify. Cody Atkinson and Sean Lawson have done all sorts of cool stuff and now run This Week In Football - a collection of writers doing great work. You should check it out.
There’s clearances and clearances. “Feels” like Hopper clearances don’t put his teammate in the clear (Shedda we miss you) and he doesn’t help his cause when, in non-clearance situations, his disposal ends a chain.
I've been playing around with my own stats database sourced from various things on the internet and discovered these nuggets, which showcases how good Hopper appears on paper vs the eye test.
For Richmond, the top 10 by clearances per game are:
Tim Taranto — 5.77 per game over 62 Richmond games
Anthony Miles — 5.46 over 61 games
Trent Cotchin — 4.87 over 296 games
Jacob Hopper — 4.87 over 53 games
Wayne Campbell — 4.79 over 149 games
Dion Prestia — 4.72 over 141 games
Shane Tuck — 4.71 over 170 games
Nick Daffy — 4.46 over 67 games
Matt Thomas — 4.29 over 14 games
Dustin Martin — 4.05 over 287 games
For Richmond only, the top 10 by disposals per game are:
Tim Taranto — 26.68 per game over 62 Richmond games
Terry Wallace — 24.55 over 11 games
John Annear — 24.28 over 65 games
Dustin Martin — 24.24 over 302 games
Jacob Hopper — 24.04 over 54 games
Robert Wiley — 23.61 over 95 games
Dion Prestia — 23.56 over 144 games
Craig Lambert — 23.54 over 121 games
Geoff Raines — 23.43 over 134 games
Wayne Campbell — 23.40 over 296 games
For Richmond only, by contested_possessions per game, the top 10 are:
Tim Taranto — 13.21 over 62 Richmond games
Jacob Hopper — 11.50 over 54 games
Dion Prestia — 10.82 over 144 games
Toby Nankervis — 10.67 over 169 games
Daniel Jackson — 10.26 over 125 games
Trent Cotchin — 9.94 over 296 games
Josh Caddy — 9.78 over 126 games
Shane Tuck — 9.72 over 126 games
Dustin Martin — 9.62 over 302 games
Bachar Houli — 9.35 over 206 games